 /
Latest Stories
/
Latest Stories
M&E: How Can Complex Themes be Evaluated?
- Monitoring and Evaluation
As internal evaluators at Nuru, we periodically assess if our impact programs are contributing to our organization’s mission of ending extreme poverty. How can a theme as complex as poverty—which varies by region and personal perspective—be concisely quantified in an actionable way?
Our team believes composite scores can be helpful. A composite score is formed when individual indicators are compiled into a single index based on an underlying theory (OECD). Generally, most composites aggregate at one or two levels:
1. A single dimension of poverty composite score. For example, a nutrition dimension could be measured by aggregating nutrition related data on dietary quantity, variety, and meal frequency.
2. A single poverty composite score. For example, aggregating several single dimensions (nutrition, education, assets) that may be unrelated to each other.
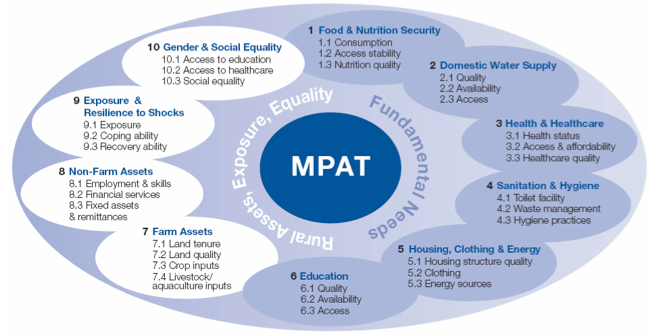
An example of how Nuru applied a composite score approach is through using the Multi-Dimensional Poverty Assessment Tool (MPAT) developed by IFAD. The MPAT creates 10 single dimension composite scores for a village. This tool, because of its intention for use in project and policy planning, stops short of a weighting process to combine these separate theme dimensions into a single poverty composite measure.
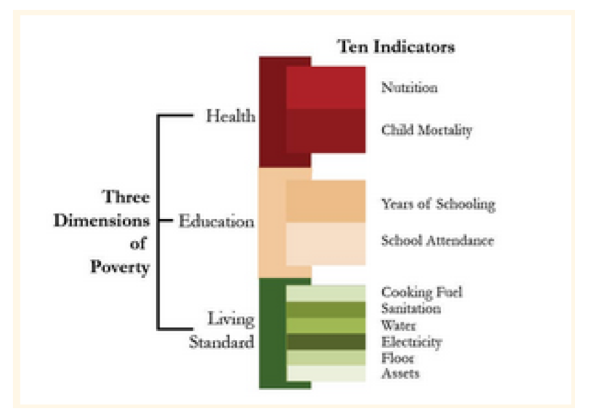
An example of a poverty composite score is the Multidimensional Poverty Index (MPI), developed by University of Oxford. It creates three single dimension scores (education, health, and living standards) first and then combines these three dimensions into a single poverty composite to ultimately categorizing each person as “MPI poor” or “MPI non-poor”. For each household, the specific indicators causing the categorization as “MPI poor” may be different.
There is little agreement among evaluators of social interventions on the best method to choose and compile individual indicators or on what provides sufficient empirical evidence of the theoretical design. This is evidenced by the many composite tools developed by different organizations to evaluate poverty, only two of which are mentioned here (MPAT, MPI).
My first introduction to composite scores was in the healthcare realm, using the standard SF-36 psychometric survey to assess perceived health outcomes after surgery on two dimensions: physical and mental (with no aggregation of these dimensions). Many of the survey questions were first developed in the 1970s. Over time, the methodology to normalize responses, weight, and compile the composite score has been proven reliable and valid across age ranges, diseases, and treatments groups; in addition, the survey has been documented in over 4,000 publications and used in more than 50 countries! This level of empirical validation and peer acceptance is nearly unheard of in the relatively new area of assessing multi-dimensional poverty. However, using the SF-36 composite has influenced what I look for in composite scoring tools when evaluating poverty for Nuru. To that point:
1. The indicators and the weighting used in the composite must align with organizational goals
For example, Nuru believes that poverty is related to a lack of meaningful choices, rather than a lack of material possessions. Many multi-dimensional poverty composite tools have material possessions as an indicator to approximate wealth, but material possessions are not a direct output goal of Nuru programs. As internal evaluators, we seek to measure changes over 1-2 year periods of time. Therefore, a poverty assessment tool with heavy weighting on material possessions may not adequately reflect the impacts of Nuru programs.
2. The composite must have been empirically validated as reliable across cultures and results shown consistent with accepted, existing measures
A good example to illustrate this point is the FANTA household hunger survey (HHS) that Nuru uses to measure hunger. The HHS was empirically validated through sample data collection from seven different locations with differing climates and in different seasons. True measures of food consumption and expenditure were not available to validate the HHS framework, so the HHS scores were compared with indicators strongly correlated with food insecurity—household wealth, dietary diversity, and income—to ensure consistency in interpretation of results. It should be noted that the original FANTA theoretical framework for hunger also included questions on food anxiety and quality. However, these questions did not prove robust and reliable across cultures. Based on the validation work, the original nine question framework was re-specified by FANTA consisting of only three questions related to food quantity[1].
3. Ensure that the survey and composite calculations are feasible to execute, provide usable information, and is clear to communicate
Nuru works with farmers in remote, rural areas. National, and even regional statistics, often do not fairly represent our target populations or program areas. Therefore, most of our evaluations occur through annual household surveys conducted by locally recruited and trained enumerators. To use a composite score, we must be able to ask the indicator questions collectively at one time during the year to the person available at home while being respectful of their time and sensitive to their cultural norms.
If the survey is feasible to execute, I then consider if the individual indicators collected will provide actionable information that informs program operations and design?
In communications, it’s important to recognize that trends in one indicator could be masked in the overall composite. For example, Nuru programs could impact nutrition significantly, but an unrelated decline in household assets may result in the household still being considered MPI poor. In this scenario, the successes of the individual program are not highlighted using the single poverty composite score approach. Another challenge with communicating composite scores in general is how to contextualize “unit-free” results. For example, MPAT dimension results in a score of 1 to 100; standing alone, this number does not have any relatable or interpretable meaning. We do not know what an MPAT Healthcare score of 25, or 50, or 75 indicates, except in relation to the other 9 MPAT dimensions, or in relation to a comparison group, but that is the basis of another blog post!
[1] FANTA, Validation of a Measure of Household Hunger for Cross Cultural Use, May 2010